Internal Markets Commentary 24th August 2020
SPX Daily chart
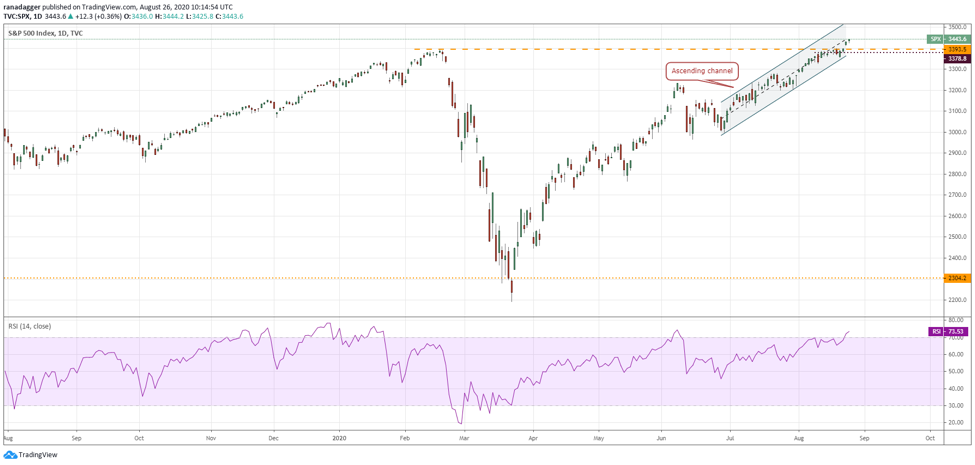
- The S&P 500 extended its new all-time highs as it closed at 3443.6 with a gain of 0.36%. The total intraday range was 18.4 points.
- Any stock or index that hits a new all-time high is bullish9 until it turns down or tops out. Although most tops can only be confirmed in hindsight, the first sign is when it dips back below the breakout8 level and does not bounce back in a hurry.
- In this case, if the index dips and sustains below 3393.5, it will suggest that the markets have rejected the higher levels.
- The RSI24 has entered the overbought zone but this, in itself, is not a reason to sell because in strong uptrends, the markets can remain overbought for a long time.
- Therefore, we are holding our positions but will quickly sell positions at the first sign of weakness that does not bounce back sharply.
- The number of stocks at new 52-week highs has still not reached triple digits is a cause of concern. Hence, we remain cautious and are not buying anything at these levels.
Market Data
- 1460 stocks advanced on the NYSE, whereas, 1523 stocks declined. 80 stocks made new 52-week highs, whereas, 11 stock made new 52-week lows.
- 1998 stocks advanced on the Nasdaq, whereas, 1343 stocks declined. 115 stock made new 52-week highs, whereas, 19 stock made new 52-week lows.
Intraday Chart
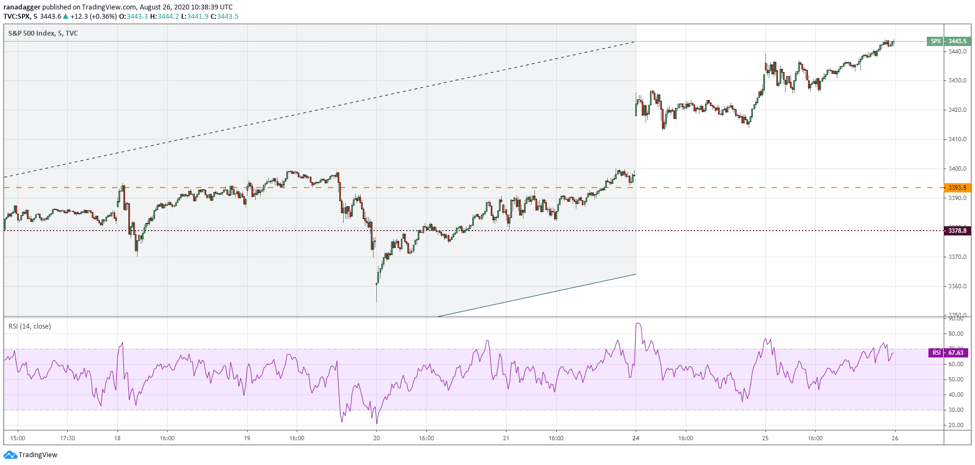
- The index opened strong but that invited profit booking in the first few minutes of trade but the bulls stepped in to buy at 3426 levels.
- From there, the index again rose to new highs, which shoes that the traders continue to buy the dips and boost prices higher.
- Today, the bulls will try to push the index above 3450 while the bears will try to pull is below 3426.
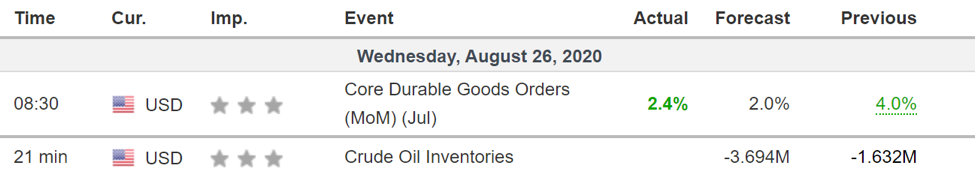
Economic Calendar
Glossary
- Ascending Channel – An ascending channel is the price action contained between upward sloping parallel lines. Higher pivot highs and higher pivot lows are technical signals of an uptrend. Trendlines frame out the price channel by drawing the lower line on pivot lows, and the upper line is the channel line drawn on pivot highs. Price is not always perfectly contained but the channel lines show areas of support and resistance for price targets. A higher high above an ascending channel can signal continuation. A lower low below the low of an ascending channel can signal trend change.
- Ascending triangle pattern – is a bullish formation that usually forms during an uptrend as a continuation pattern.
- Bearish (view) – Investors who believe that a stock price will decline.
- Bearish Engulfing pattern – chart pattern that consists of a small white candlestick with short shadows or tails followed by a large black candlestick that eclipses or “engulfs” the small white one.
- Bottom- the lowest price reached by a financial security, commodity, index or economic cycle in a given time period. A specific time span is usually used to determine a bottom, and that timeframe can be a year, month or even intraday.
- Break – a rapid and sharp price decline.
- Breakdown – price movement through an identified level of support, which is usually followed by heavy volume and sharp declines.
- Breakout- a price movement of a security through an identified level of resistance, which is usually followed by heavy volume and an increased amount of volatility.
- Bullish (view) – Investors who believe that a stock price will increase over time
- Candlestick – a chart that displays the high, low, opening and closing prices of a security for a specific period. The wide part of the candlestick is called the “real body” and tells investors whether the closing price was higher or lower than the opening price.
- Consolidation- is used in technical analysis to describe the movement of a stock’s price within a well-defined pattern of trading levels. Consolidation is generally regarded as a period of indecision, which ends when the price of the asset moves above or below the prices in the trading pattern
- Correction – a reverse movement, usually negative, of at least 10% in a stock, bond, commodity or index to adjust for an overvaluation; generally temporary price declines interrupting an uptrend in the market or an asset; shorter duration than a bear market or a recession, but it can be a precursor to either.
- Descending Triangle pattern – A bearish chart pattern that is created by drawing one trendline that connects a series of lower highs and a second trendline that has historically proven to be a strong level of support.
- Doji – candlesticks that look like a cross, inverted cross or plus sign; forms when a security’s open and close are virtually equal for the given time period and generally signals a reversal pattern for technical analysts
- Double top – technical analysis to describe the rise of a stock, a drop, another rise to the same level as the original rise, and finally another drop.
- Dry powder – is a term referring to marketable securities that are highly liquid and considered cash-like. Dry powder can also refer to cash reserves kept on hand by a company, venture capital firm or individual to cover future obligations, purchase assets or make acquisitions. Securities considered to be dry powder could be Treasuries or other short-term fixed income investment that can be liquidated on short notice in order to provide emergency funding or allow an investor to purchase assets.
- Evening Star – a bearish candlestick pattern consisting of three candles that have demonstrated the following characteristics: the first bar is a large white candlestick located within an uptrend; the middle bar is a small-bodied candle, red or white, that closes above the first white bar; and, the last bar is a large red candle that opens below the middle candle and closes near the center of the first bar’s body. This pattern is used by traders as an early indication the uptrend is about to reverse.
- Falling Knife – is a colloquial term for a rapid drop in the price or value of a security
- Gravestone doji – a type of candlestick pattern that is formed when the opening and closing price of the underlying asset are equal and occur at the low of the day.
- Head and Shoulders pattern – a chart formations that predicts a bullish-to-bearish trend reversal; believed to be one of the most reliable trend reversal appears. It is one of several top patterns that signal, with varying degrees of accuracy, that an upward trend is nearing its end.
- Inside Day formation – A candlestick formation that occurs when the entire daily price range for a given security falls within the price range of the previous day. Inside day often refers to all versions of the harami pattern and can be very useful for spotting changes in the direction of a trend.
- Long legged doji – a type of candlestick formation where the opening and closing prices are nearly equal despite a lot of price movement throughout the trading day. This candlestick is often used to signal indecision about the future direction of the underlying asset.
- Pullback – the falling back of a security’s price from its peak. These price movements might be seen as a brief reversal of the prevailing trend higher, signaling a temporary pause in upward momentum. Also referred to as a retracement or consolidation
- Relative Strength Index – (RSI) is a momentum oscillator that measures the speed and change of price movements. RSI oscillates between zero and 100. Traditionally RSI is considered overbought when above 70 and oversold when below 30.
- Resistance – a price point on a bar chart for a security in which upward price movement is impeded by an overwhelming level of supply for the security that accumulates at a particular price level.
- Rounding Top pattern – is identified by price movements that, when graphed, form the shape of an upside down “U”; may form at the end of an extended upward trend and indicates a reversal in the long-term price movement; considered a rare occurrence.
- Support Level – refers to the price level below which, historically, a stock has had difficulty falling. It is the level at which buyers tend to enter the stock.
- Wedge – a security price pattern where trend lines drawn above and below a price chart converge into an arrow shape.
admin
2021-01-28T15:08:28+00:00

Internal Markets Commentary 24th August 2020
SPX Daily chart
Market Data
Intraday Chart
Economic Calendar
Glossary